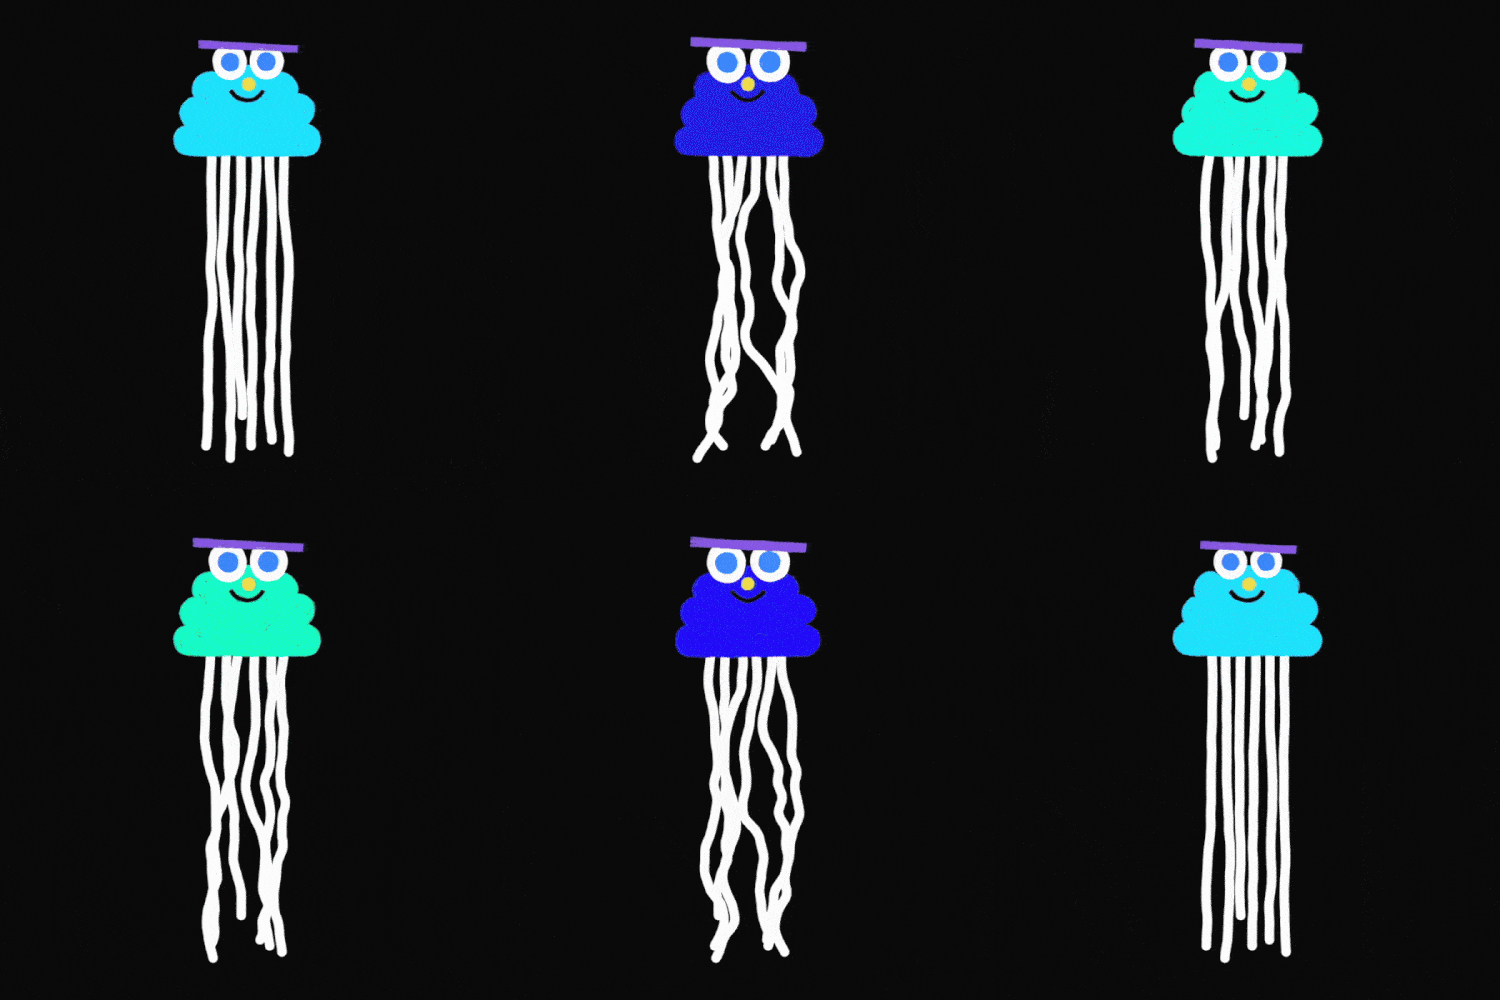
Jellymonster
ISSUE 013 - A Jellyfish You Can Talk To
TLDR: I made an interactive Jellymonster that reacts to sound — play with it here! Also, some thoughts on turning data into characters.
JELLYMONSTER
I dipped my toes into coding recently. WAIT! Don’t click off this post yet. Think of the coding talk like a Cream Cracker… dry, yes, but carrying us somewhere fun.
I wanted to make some interactive/responsive artworks that changed based on different inputs. How hard could that be?
Turns out, yes, quite hard.
But I persevered (go me!) and managed to make some simple interactive shapes. Those grew into more complex functions, and eventually, characters.
Why?
Interactive works are fun, right? And I’d never made anything like that before.
I had this idea of taking invisible/boring/complex inputs and embodying them in a character.
Let me show you what I mean.
Enter Jellymonster!
👉 You can play with it here 👈
Fun, no?
This is a proof of concept: taking something you normally can’t see (in this case, sound waves) and embodying it in a character so you can see it. Or… dare I say… even communicate with it?
So, what’s actually going on here? Your device’s mic picks up sound waves, which are broken down into bass, amplitude, and frequency. Those values (through some code and a few animated shapes) drive Jellymonster’s movement and reactions.
Basically, it’s taking invisible data and making it visible, and hopefully fun.
WEATHERMONSTER
Before Jellymonster, I made a character that interacted with historical real-world data. So (as you do), I downloaded 100 years of weather records from a weather station in Oxford.
And here’s a snippet of that data from 1929:
3.7, 3.3, 12.9, 11.8, 17.1, 18.9, 22.7, 21.2, 23.2, 14.1, 11.0, 9.2, 9.0, 5.4, 9.8, 12.5, 15.6, 21.1, 20.1, 21.2, 18.0, 14.6, 10.2, 7.0, 6.5, 7.4...Not exactly the most gripping read. And that’s about 0.01% of the total dataset.
But (AND HERE’S THE WHOLE PREMISE OF WHAT I’M TRYING TO DO) what if that data became a living character?
Enter Weathermonster!
I feel like what the monster is showing is mostly intuitive, but what’s going on is:
🌡️More red = hotter temperatures
🌧️ Bigger body = more rainfall
🌞 Bigger eyes = more sunlight
You get the idea. Instead of scrolling through spreadsheets, you kind of feel the data through this character.
That said, I ran into a problem. I write stories for kids, often science related ones, and I’m at pains to make sure I communicate those concepts thoughtfully and accurately. I thought by using ‘pure’ data here I wouldn’t have to do that.
But!
I chose to use yearly averages instead of monthly data (so the video wasn’t 3 hours long), and that meant any extreme summer heatwaves or brutal winters got smoothed out*.
So even using the ‘pure’ data, I was still shaping the narrative by choosing what to show and how. Turns out, data is still storytelling.
*The big picture is still useful: average temps (at this particular weather station) have gone up a lot the last 30 years.
WHAT NEXT
So that’s the formula for these embodied monsters:
Take invisible/boring/complex data
Mix it with a code-driven character
Play with your new embodied dataset!
There are a bunch of other real-world inputs I want to try:
🌫️ A character that shifts from bright colours to grey depending on air quality.
🧲 A character that reacts to electromagnetic fields.
🌱A character that responds to soil pH.
I love the idea of making invisible things visible. Turning abstract data into something you can see and feel.
Gonna keep plugging away at these. In the meantime — lemme know if you play with Jellymonster, and what noises it likes best.


Interestingly, I think these monsters would be more useful for adults, because children are not going to question how bad climate change is, they are not going to say “I don't see any difference in the last 20 years”. You should pitch that to companies.
I like the idea of the air quality character 🤩
Btw what are the little yellow dots at the end of the video?
You're so clever xxx